Do high schoolers feel prepared for life after graduation?
On average, 60% of Illinois high school graduates do not enroll in a 4-year university within 12 months of graduation at a traditional 4-year institution. Most graduates in Illinois go directly into the workforce, enroll in community college, attend trade schools, or pursue other career alternatives. With this in mind, is our education system adequately preparing students for life after graduation? If we were to ask students, do they feel prepared for life after graduation?
Our summer fellowship for high school students and recent graduates focuses on addressing this topic. Illinois high schools and districts offer a variety of CTE, Dual Credit, and Work-Based Learning programs. Some high schools support students by connecting them to internships, career fairs, and employers. These programs and resources allow students to explore a variety of interests that could potentially lead them into a career or guide their next steps after graduation.
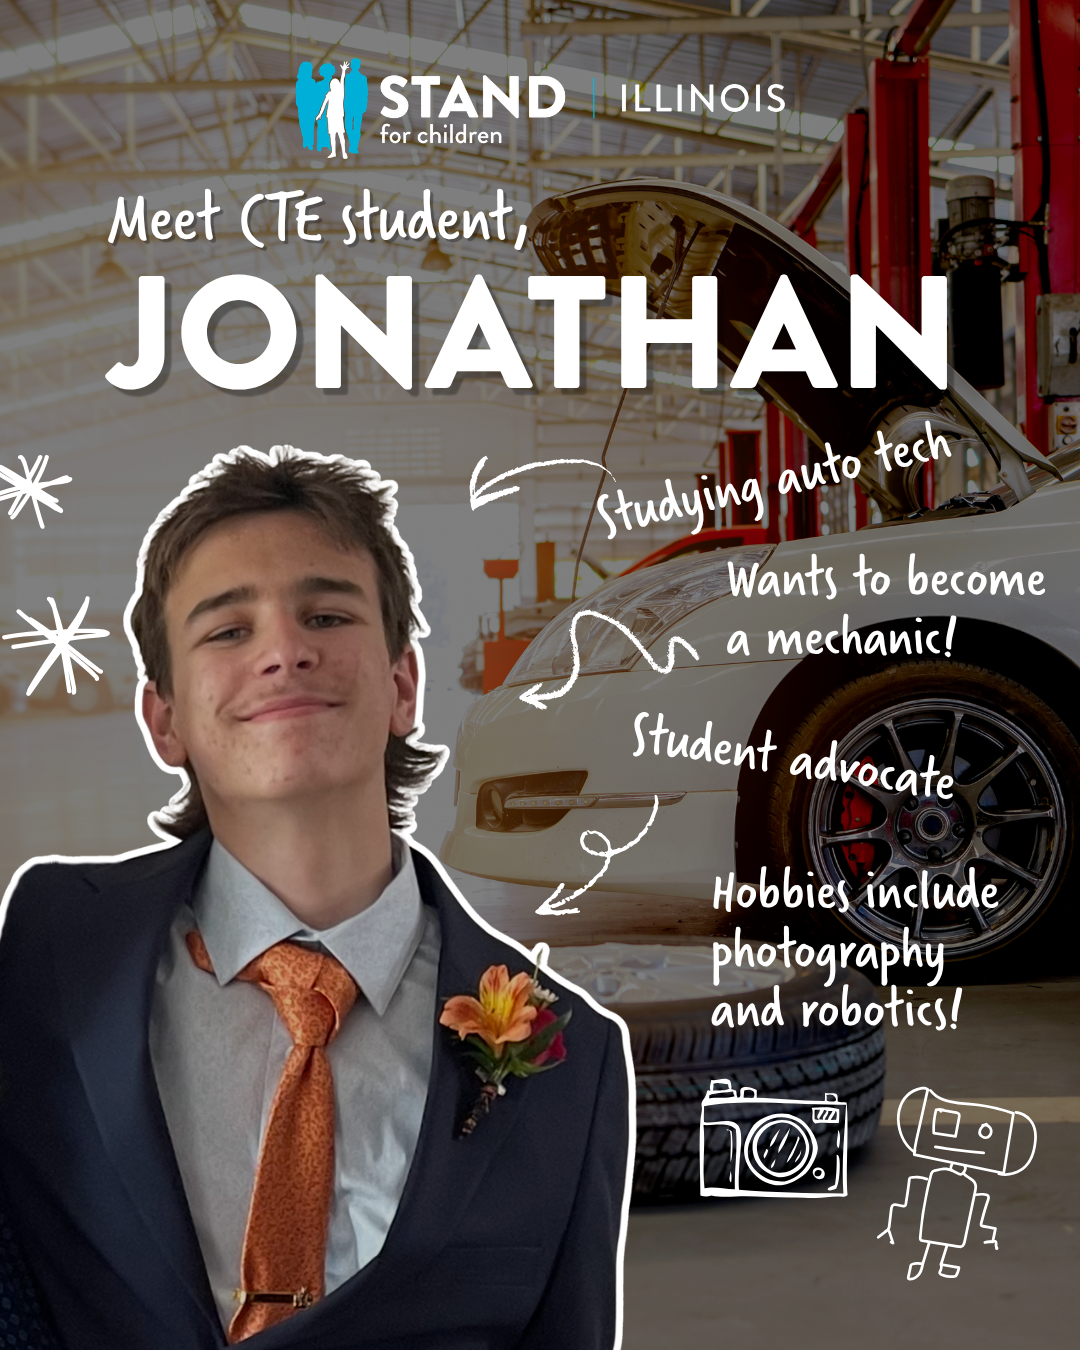
Jonathan Royer is a current high school junior who already knows what he wants to do after graduation. He discovered his passion when his school connected him with Springfield’s Capital Area Career Center and eventually 4-H. He began exploring interests like robotics, photography, advocacy and eventually led him to decide he wanted to become a mechanic.
“4H has really helped me a lot. It’s allowed me so many opportunities. I’ve attended conferences in Washington, DC… It’s a great program and it has allowed me to find my passion in auto tech.” Jonathan Royer
However, not all students in Illinois have access to these resources and programs across the state. Depending on the school district, some students have access to individualized mentorship, internship programs, advocacy organizations, career centers, trade schools, and more. While other students might be on their own to figure out a plan or rely on their own family networks to get that first job right after high school. One thing is true:
Illinois high school students do not receive the same opportunities and support to find their next step after graduation.
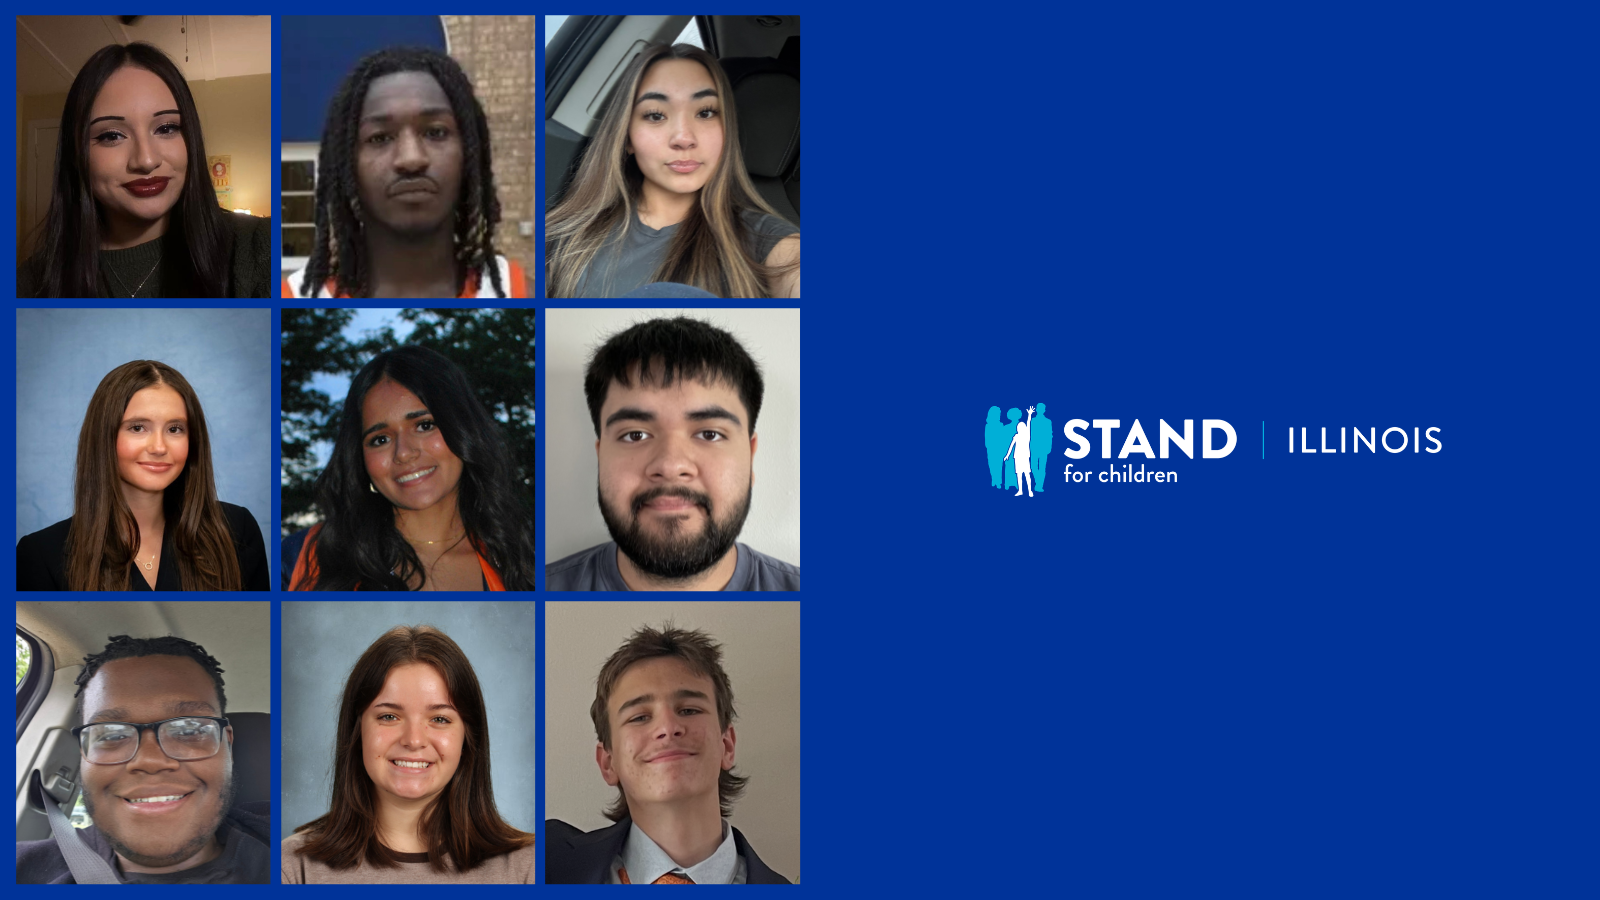
Our summer fellows represent the diverse backgrounds and experiences of Illinois high school students. They bring their own unique experiences, stories, and goals for what they want to accomplish after graduation. With their help, we will receive an insight into how our current education policies have impacted their lives, and how prepared they feel for graduation.
By equipping our fellows with the knowledge and tools to advocate for change, we hope to support the young generation of leaders embarking on their new journey into adulthood. We look forward to their final projects and insights into what Illinois can do to best support students in graduation readiness.