Evidence-Based Funding
In 2017, Illinois enacted a new approach for distributing state dollars to school districts called the Evidence-Based Formula (EBF). EBF replaced a formula that had been in place for over two decades and national studies had declared was the most inequitable in the country.
The path to passage of EBF took years of political fights, proposals, task forces, and active advocacy. Often front-page news, the fight for fair funding ultimately resulted in a bi-partisan agreement where there would be no “winners or losers” among school districts.
Under EBF, no district loses money, and, as new state dollars become available, they flow first to the school districts that need them the most. These districts are described as the “most underfunded” or the “furthest from adequacy.” If Springfield doesn’t increase the education budget, additional funds do not flow through to school districts that fiscal year. So, fulfilling the promise of evidence-based funding depends on whether the state budget includes more funds for education each and every year.
Springfield has come through nearly every year since EBF passed. It allocated $350 million in new State dollars to EBF for fiscal years 2018 and 2019 and $375 million for fiscal year 2020. After the COVID-19 pandemic left the State’s budget in tatters, Springfield provided Illinois schools with flat funding for fiscal year 2021, avoiding cuts that many feared while also pausing the progress of closing the funding gap. FY2022 saw a much-needed return to funding the $350 million increase.
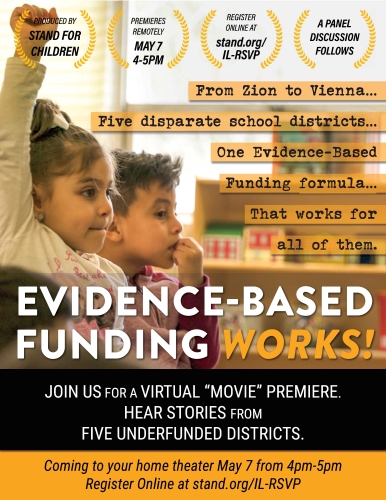
Districts across Illinois are investing their EBF funds to improve learning and restore cuts that they endured after years of underfunding. Learn more from five districts across Illinois and their experience with EBF in our Evidence-Based Funding Works video series.
This is great progress, but we have a long way to go until every Illinois student attends an adequately funded school. Even after three years of increased investments, the model still falls $6.8 billion short of full funding, leaving 330 school districts funded below 70% of adequacy.
Another huge step towards equity would be addressing the other major inequity in school funding still remaining — how employer costs for teacher pensions are handled.
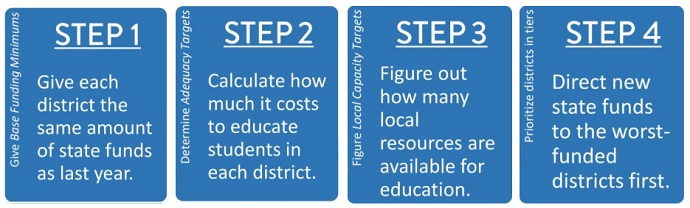
There are four components to the evidence-based funding formula.
1. The Base Funding Minimum (BFM), which is a “hold harmless,” guaranteeing every district it will receive the same amount of funding from the state that it received before; this is the no winners-or-losers compromise. Each year, the first cut of the EBF appropriation goes to funding the BFM, giving each district the same amount in state funds it received the prior year.
2. The Adequacy Target Calculation considers what each district needs in order to adequately educate its students. For example, what is the right ratio of students per teacher, librarian, nurse, and social worker? What additional supports to low-income students and English learners are needed? Most of these calculations are based on the evidence from years of research. Each Adequacy Target is adjusted to reflect the cost-of-living for the region in which the district is located.
3. The Local Capacity Target (LCT) considers each district’s property wealth and determines how much capacity it has to raise funds locally. Some districts can fund 90% of their Adequacy Target through local resources, while others are expected to generate less than 10%. Most fall somewhere in between.
By using the above three data points, we can tell how adequately funded every single school district is. Adding the BFM and LCT tells us how much each district has, and the Adequacy Target tells us what each district needs. If a district has a BFM of $5k per pupil and an LCT of $5k per pupil, it has $10k per pupil currently available. If its Adequacy Target is $12.5k per pupil, we can see it is 80% funded.
4. The Distribution Formula is the final step, distributing all new money invested in the formula through “tiers.” After every district’s Adequacy Percentage is calculated, we can line them up from worst- to best-funded. The first half of new funds go to the “Tier 1” districts; these are the furthest away from adequate funding. The next 49% of new funds go to the “Tier 2” districts, which includes every district below 90% of adequacy (including Tier 1 districts). Finally, the last 1% of new funds goes to Tier 3 districts that are between 90-100% funded and Tier 4 districts above 100% funded.